Forecast of Hp30, Hp60 & Kp Indices
Background
Geomagnetic activity indices such as Kp and the higher-resolution Hpo (Hp60 and Hp30) are essential for forecasting, as solar-driven geomagnetic disturbances can significantly impact technological systems and human activities on Earth and in near-Earth space. Our new forecast model (Kervalishvili et al., 2025) improves prediction accuracy by incorporating data from individual Kp-observatories, capturing local physical effects often overlooked by traditional models based on a single global index. By first predicting local indices and then combining them using standard procedures to generate global indices like Kp and Hpo, the model bridges the gap between localized measurements and global forecasts, preserving site-specific physical influences. This localized approach enhances the accuracy of the Kp, Hp60, and Hp30 indices, effectively capturing key trends and overall geomagnetic behaviour even when solar wind data is sparse or incomplete.
Note that unlike the Kp index (Matzka et al., 2021), which is limited to a maximum value of 9 and has a three-hour resolution, the Hpo index (Yamazaki et al., 2022) is open-ended and available at higher temporal resolutions, one hour (Hp60) and half an hour (Hp30), providing a more detailed and scalable representation of geomagnetic storm intensity.
Forecast Model
We have developed a machine learning-based forecast model that leverages solar wind parameters from the high-resolution OMNI dataset and the Sunspot number from the low-resolution OMNI dataset. Minute-by-minute data is used for parameters such as IMF Bt, proton density, and solar wind speed, while hourly data is utilized for the Sunspot number. This model is built on the simplified framework of Kervalishvili et al. (2025), focusing on IMF Bt and a constant Sunspot number (SSN) to generate forecasts.
Figure Description
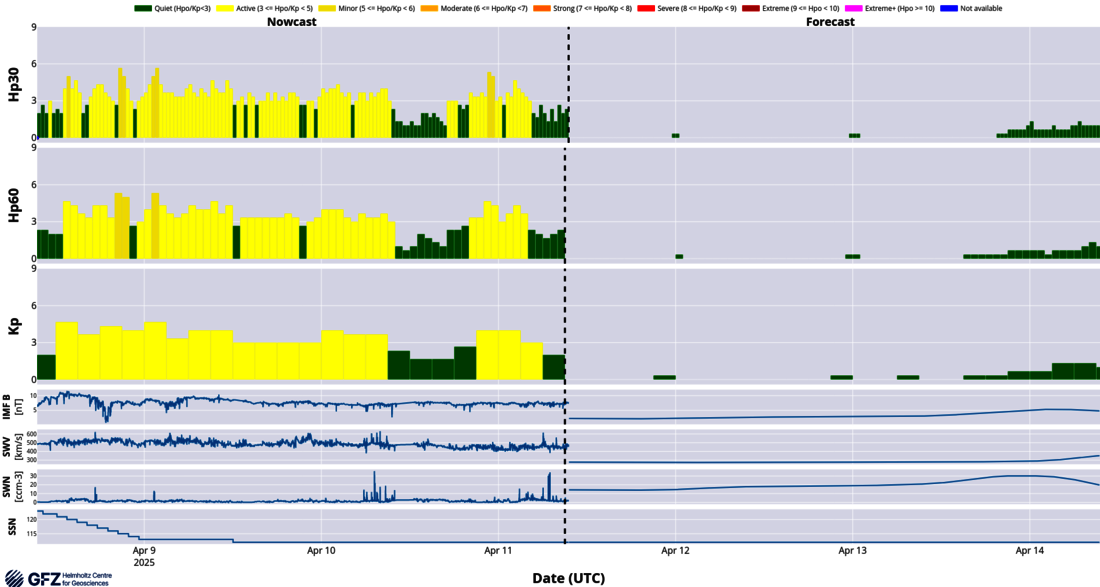
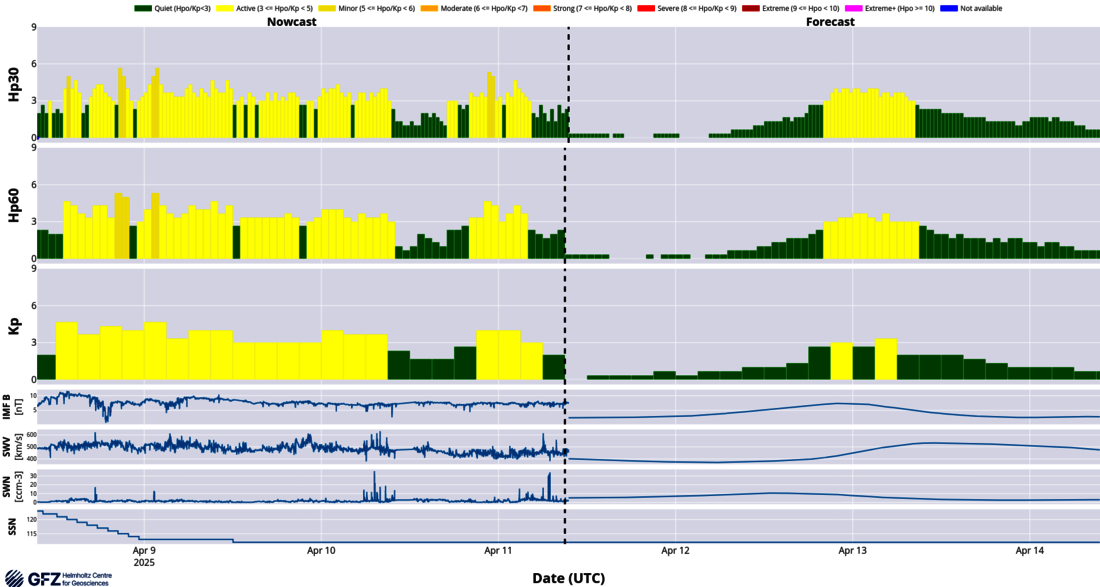
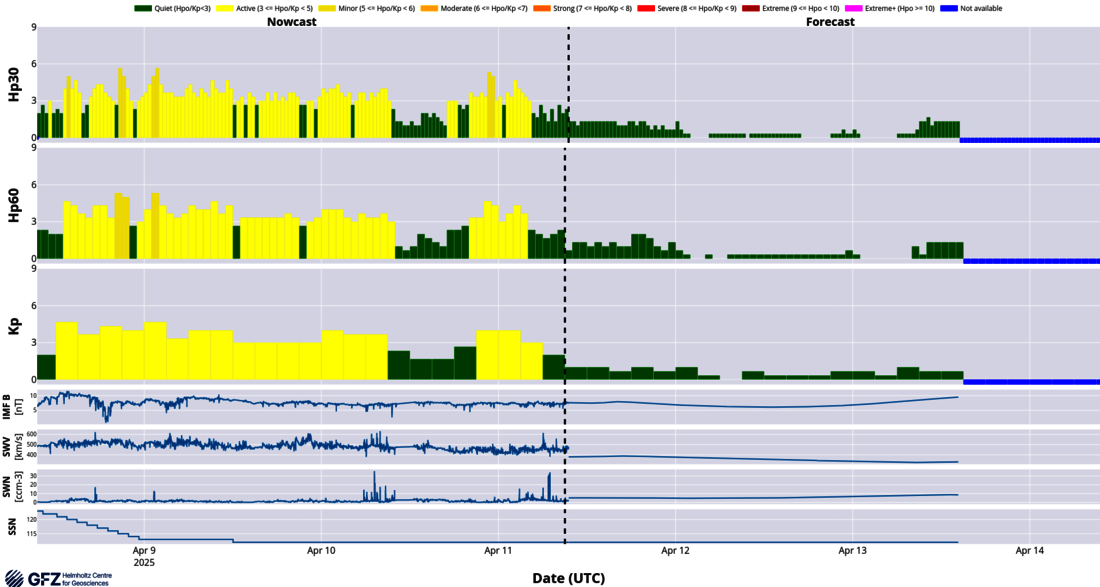
The figure below presents a 3-day nowcast and 3-day forecast of geomagnetic Kp and Hpo indices. The first panel displays the Hp30 index, the second panel shows the Hp60 index, and the third panel presents the Kp index. The vertical dashed line in each panel marks the boundary between the nowcast (left) and forecast (right). The figure is updated hourly, with colour coding for values ranging from Minor to Extreme based on the NOAA Space Weather Scales.
Download and Description
The model has been applied to sunspot number forecast data for the next 72 hours provided by NOAA SWPC and solar wind forecast provided by EUHFORIA (v 1.0.3) is a 3D MHD heliosphere model.
Download
The model has been applied to solar wind forecast and sunspot number forecast data for the next 72 hours provided by NOAA SWPC.
Download
The data/data products are provided “as-is” without warranty of any kind either expressed or implied, including but not limited to the implied warranties of merchantability, correctness and fitness for a particular purpose. The entire risk as to the quality and performance of the Data/data products is with the Licensee. In no event will GFZ be liable for any damages direct, indirect, incidental, or consequential, including damages for any lost profits, lost savings, or other incidental or consequential damages arising out of the use or inability to use the data/data products.


